
The rise of veganism and movement towards people consuming a more sustainable diet, whether that’s eating with the seasons, having a meat-free day each week or buying food locally, has meant that the diet we eat has changed greatly. Using data from the UK Government on the quantity of different foods purchased each week, we’ve analysed 25 years of the UK diet to see which foods have risen in popularity and what we’re eating less of.
Food Trends In The UK
- Dairy
- Fruit & Veg
- Carbohydrates
- Meats & Fish
- Fats & Sugars
- Beverages
- Other
 Food
Food Units
Units 1993
1993 2017/18
 Change %
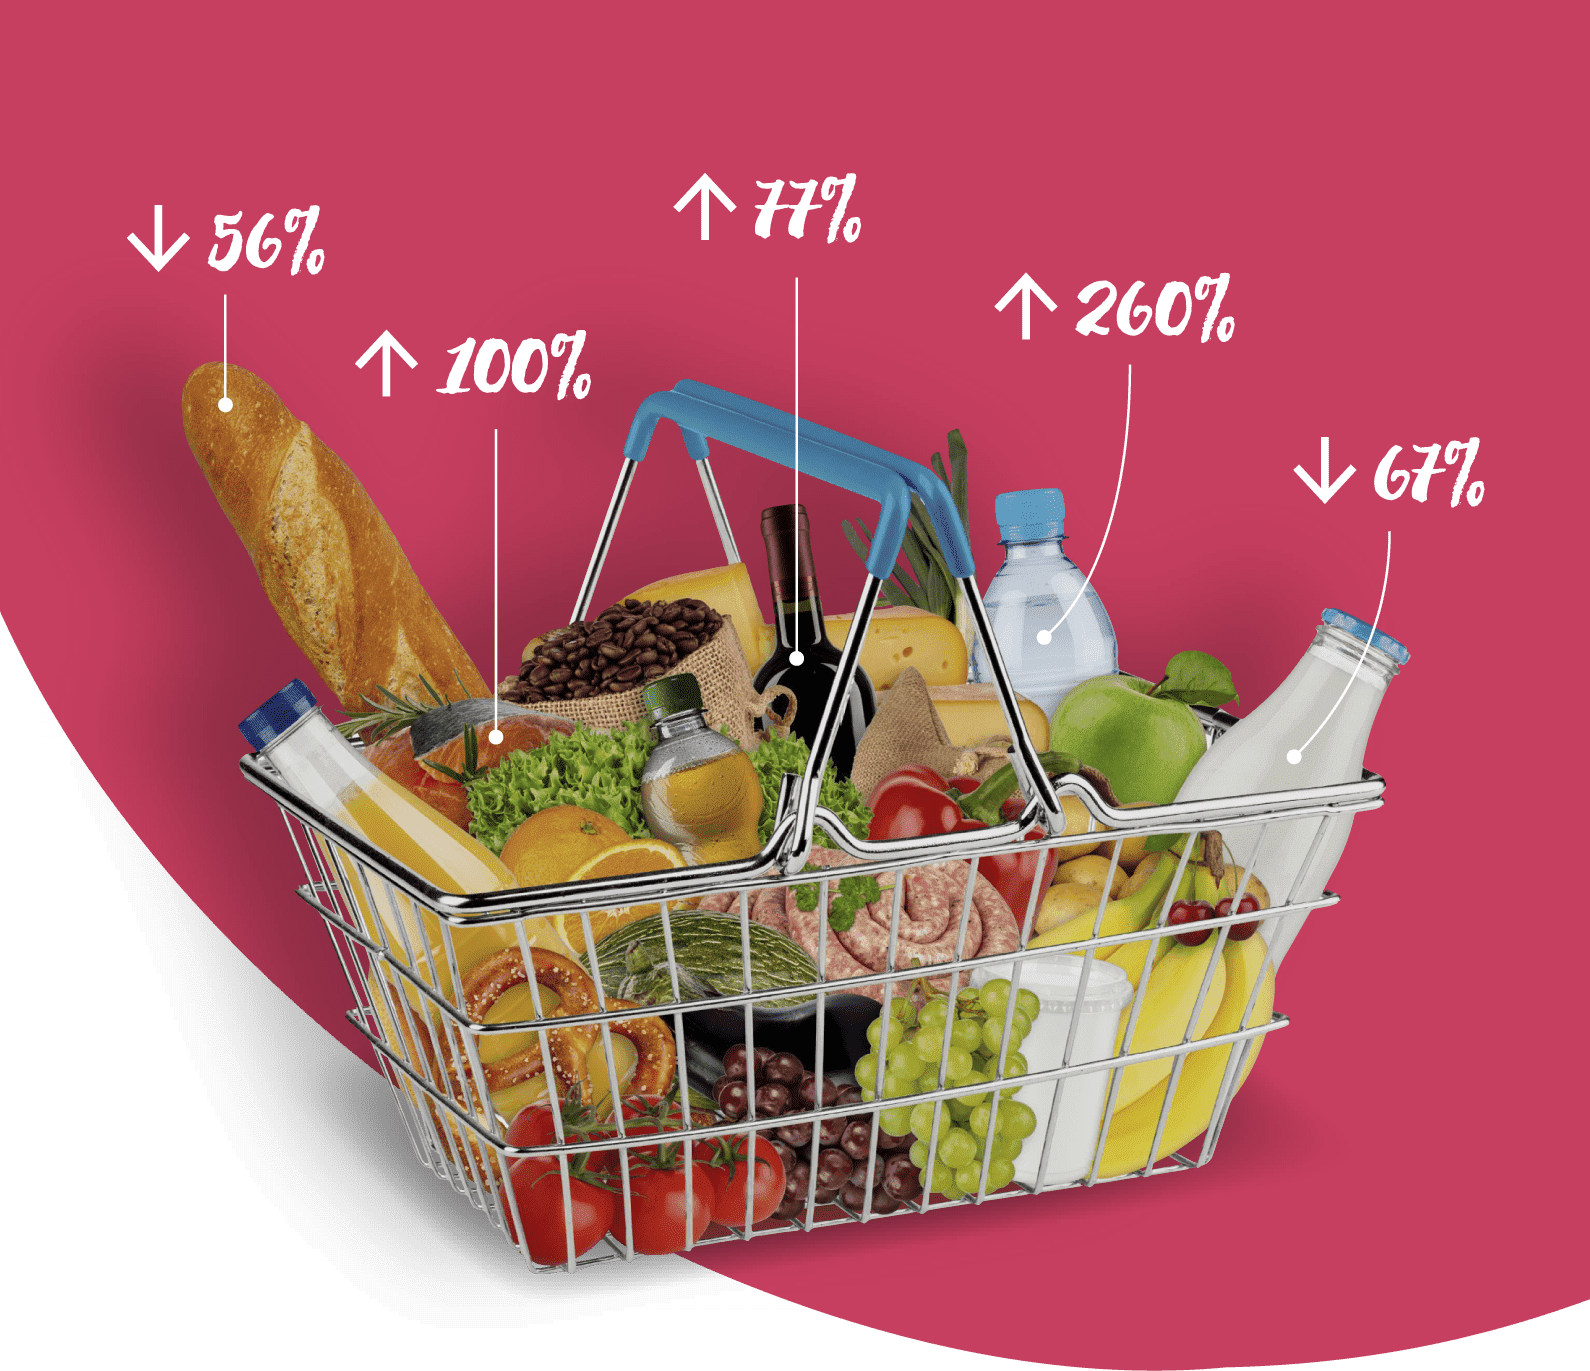
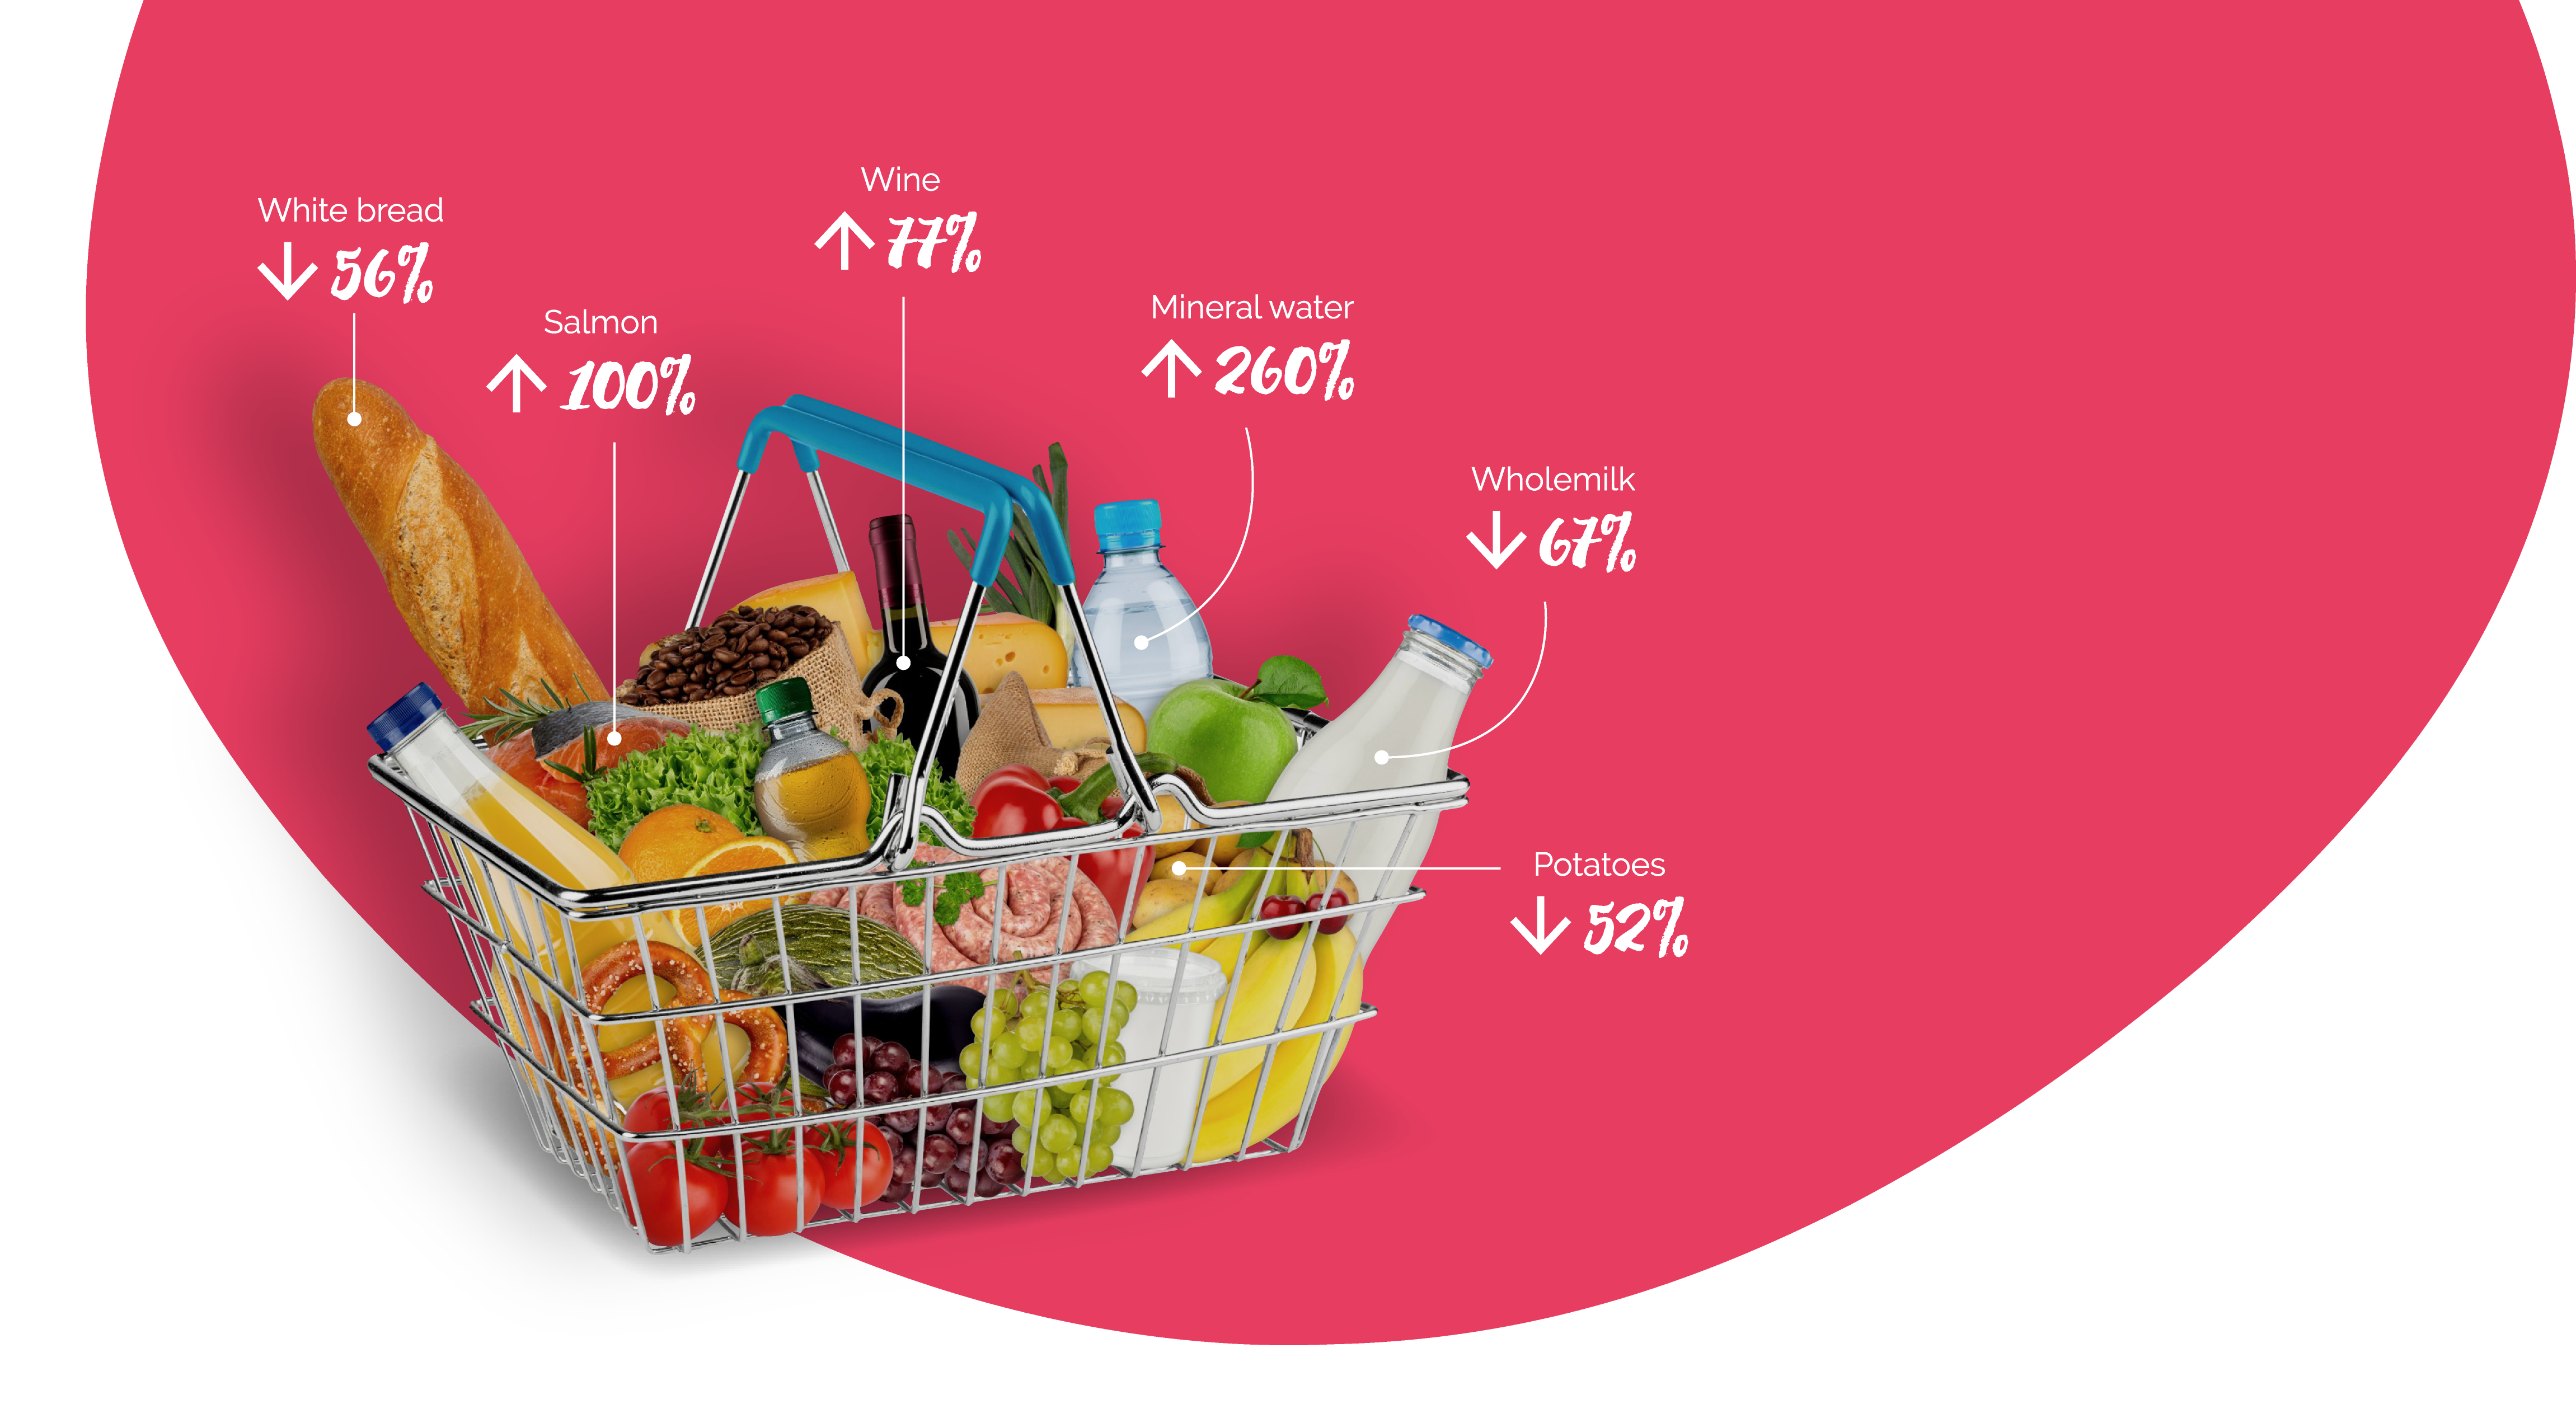
Take a look at the stacked bar chart below to see which foods have seen the biggest increase and decrease in quantities purchased.
% change between 1993 and 2017/18
Biggest increase Positive
-100
-50
0
50
100
150
200
250
300
350
Biggest decrease Negative
-100
-50
0
Methodology
We’ve used data from Gov.UK which looks at the units purchased per person, per week for a variety of foods. We looked at items that had data from 1993 onwards to provide 25 years of changes in the UK diet. Only products with specific descriptions were included, any descriptions that grouped products by ‘other’ were removed. Eggs are stated as the number of eggs purchased per person week rather than in milliliters or grams. All data can be viewed in this document.